from the Image Subtraction Method
The catalog contains data for 2016 variable stars found in the four OGLE-I fields, MM1-A, MM1-B, MM7-A, and MM7-B. This is the result of the reanalysis of the OGLE-I observations with the Image Subtraction / Difference Image Analysis method. The results for the other 16 OGLE-I fields will be included soon. The catalog contains:
- Photometric time-series for all stars in the IC (DATA_I) and V filters (DATA_V),
- The light curves in a graphical form. The IC-filter magnitudes are plotted as a function of the phase of the derived period (for periodic stars) or heliocentric Julian Day (for non-periodic stars and periodic stars with periods longer than 25 days) (PLOTS).
- Accompanying tables (TABLES).
The variable stars are divided into 13 categories defined here. The table below gives the number of stars of a given type in the catalog.
The files which are referred to via DATA_I and DATA_V links in the table above contain tarred and gzipped files with photometry for individual stars. The individual files are named according to the following scheme: <star_name>[subfield]_<filter>.dat, e.g. MM1-0090A_I.dat. The subfield (A or B) is used only when a star was observed in both overlapping fields. Otherwise, the subfield is omitted, so the data file has a name like MM1-0090_I.dat. The data files contain the following entries:
- Column 1: heliocentric Julian Day,
- Column 2: difference flux (in arbitrary flux units),
- Column 3: error of the difference flux (units as above),
- Column 4: magnitude transformed from the difference flux (in mag),
- Column 5: error of the magnitude (in mag). This error is transformed from that given in column 3 and does not include the errors of transformation.
The files which are referred to via PLOTS links in the table above contain tarred and gzipped files with PostScript plots of the IC-filter light curves as well as finding charts. A sample chart for a periodic star is shown below.
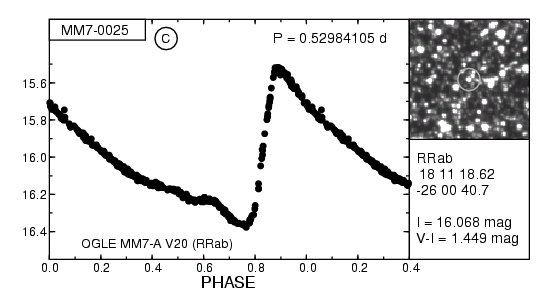
The light curve is shown in the left-hand panel. The magnitudes are folded with the period shown in the top right corner. The star name is given in top left corner, whereas the cross-identifications are given in the bottom. If the data from two adjacent parts of the field were combined, like in this case, an encircled 'C' letter appears right of the star name. The right-hand top panel shows finding chart of 99 x 99 pixels (43'' x 43'') with the variable star centered and encircled with a light-grey circle. In the right-hand bottom panel, the classification, right ascension, declination, IC-filter magnitude and (V-IC) colour, are given.
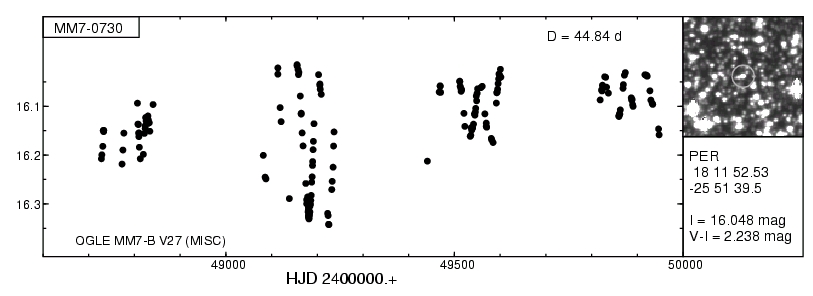
For stars classified as APER, MIRA, MLE and PER with dominating periods longer than 25 days the light curve is shown as a function of heliocentric Julian Day (see figure).
Finally, the files which are referred to via TABLES links in the table above contain text entries for variable stars. The tables include the following information:
- Column 1: star name in the catalogue,
- Column 2: right ascension (epoch J2000.0) in hours, minutes, and seconds,
- Column 3: declination (epoch J2000.0) in degrees, arcminutes, and arcseconds,
- Column 4: variability class,
- Column 5: period (in days), for periodic stars only,
- Column 6: number of observations in the IC filter,
- Column 7: number of observations in the V filter,
- Column 8: reference IC-filter magnitude,
- Column 9: reference (V-IC) colour index,
- Column 10: cross-identifications. The stars are cross-identified with the following OGLE-I catalogs:
- Udalski et al., 1997, Acta Astronomica 47, 1.
Syntax of a star name: OGLE <field> V<number>, e.g., OGLE MM7-B V33. - Woźniak & Szymański, 1998, Acta Astronomica 48, 269.
Syntax of a star name: WS <field>.<number>, e.g., WS MM1B.198992 for variable stars
and OGLE #<number>, e.g., OGLE #14 for microlensing events. - Żebruń, 1998, Acta Astronomica 48, 289.
Syntax of a star name: OGLE-LT-V<number>, e.g., OGLE-LT-V101. - Szymański, Kubiak & Udalski, 2001, Acta Astronomica 51, 259.
Syntax of a star name: SKU <field>.<number>, e.g., SKU MM7A.34501.
- Udalski et al., 1997, Acta Astronomica 47, 1.